Considering the importance of real-time data collection to modern enterprises, observability is a critical component of time-series databases and other platforms. System administrators need quick access to the running status of their systems and must know as soon as possible if any issues have occurred so that they can begin to diagnose and resolve them.
TDengine provides this observability through the taosKeeper component, which logs system metrics, and through TDinsight, a free Grafana dashboard that you can use to visualize the status of your deployment. TDinsight is available to TDengine OSS, TDengine Enterprise, and TDengine Cloud users and is an essential part of system monitoring for your data historian.
Configuring TDinsight
To use TDinsight, first ensure that taosKeeper has been configured to monitor your deployment. See the taosKeeper documentation for details. Once configured, taosKeeper will store system metrics in a specified database in your TDengine deployment that can be queried just like any other database. You can also choose to record taosAdapter metrics if desired.
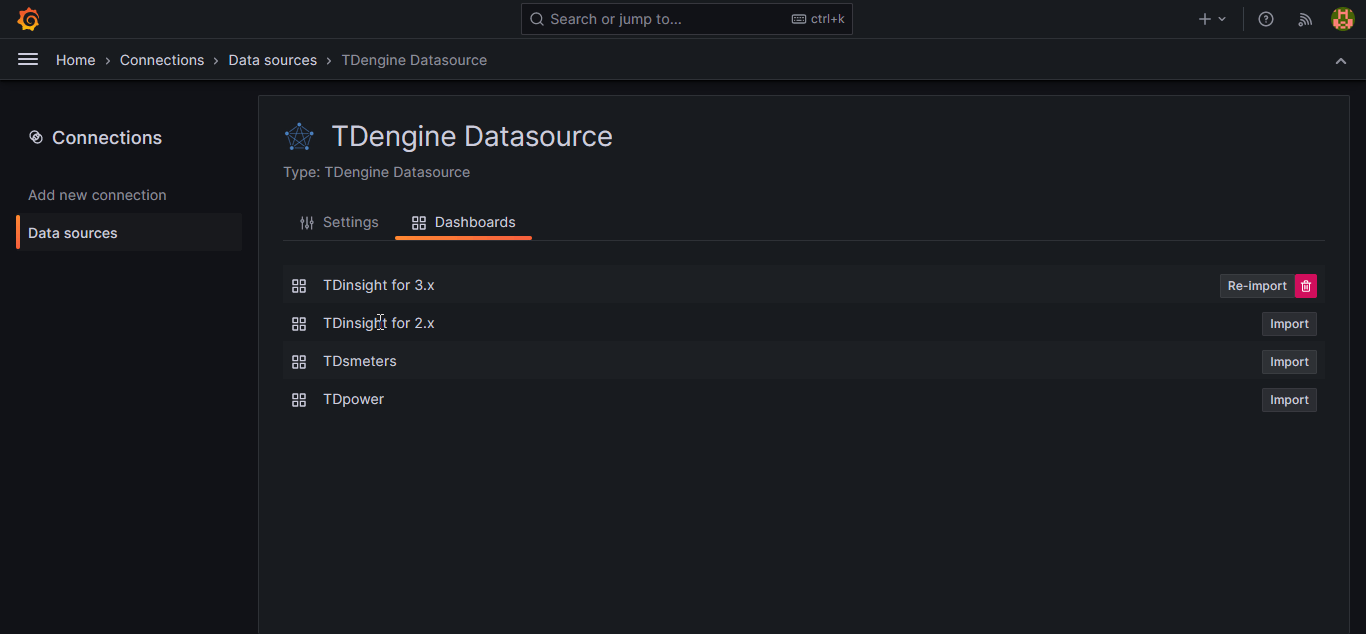
Next, install Grafana or register for the Grafana cloud service and deploy the TDengine datasource plugin. The plugin includes the latest version of TDinsight, which can be accessed on the Dashboards tab after the plugin has been installed.

Using TDinsight to Monitor TDengine
After installing the TDinsight dashboard, open it in Grafana and ensure that the Log from drop-down list in the top left is set to the database that taosKeeper uses for storing monitoring metrics. Once this is configured, the panels in the dashboard will be populated with data from your TDengine deployment.
The TDinsight dashboard contains sections and panels that monitor the components of your deployment:
- Cluster Status: overview of your deployment, including version, uptime, and the number of tables, databases, and nodes.
- Dnodes Overview: the status and uptime of your dnodes
- Mnodes Overview: the status of your mnodes
- Requests: information about the data read and write requests being received by your deployment
- Tables Summary: the number of supertables and tables in your deployment along with their distribution among vgroups
- Dnode Usage: the status of your dnodes, including CPU, memory, and disk usage
- taosAdapter: information about the requests being received by taosAdapter

For more information about TDinsight, see the official documentation.


